
Victory! During the third lab session Ben completed the program so that it calculates the black hole accretion rates for all the AGN using the X-ray and radio data previously calculated in the program, and the errors for them.
Accretion rates were calculated using the X-ray and radio data respectively using the following equations:


Long at last, we now have a complete catalogue of data for the 322 individual AGN sources, 57 of which are detected in both the X-ray and radio.
Every piece of data was from the Chandra COSMOS Legacy survey, the VLA COSMOS survey, and our own calculations were collated into one large catalogue using TopCat. This means we can easily compare the two data sets and the methods used in each study. Our values are expected to differ slightly due to the different cosmologies used in the two studies but these differences shouldn’t have much effect on the overall trends.
Now analysis of the data can begin. Our initial observations were that the highest black hole accretion rates are found between red shift 2.2 and around 3.5. This is promising as it is agreement with other papers we have looked at.
There are some sources in the catalogue of AGN are not checked as being in the radio or the Chandra full detect because they don’t pass the 3 sigma signal to noise cut threshold limit, however they still have been included as AGN since they are luminous to be classed as such.
In next weeks lab we plan to properly dive into analysis of the data by binning the sources based on morphology, red shift and luminosity. But for now we begun by plotting a few basic plots to investigate overall trends.


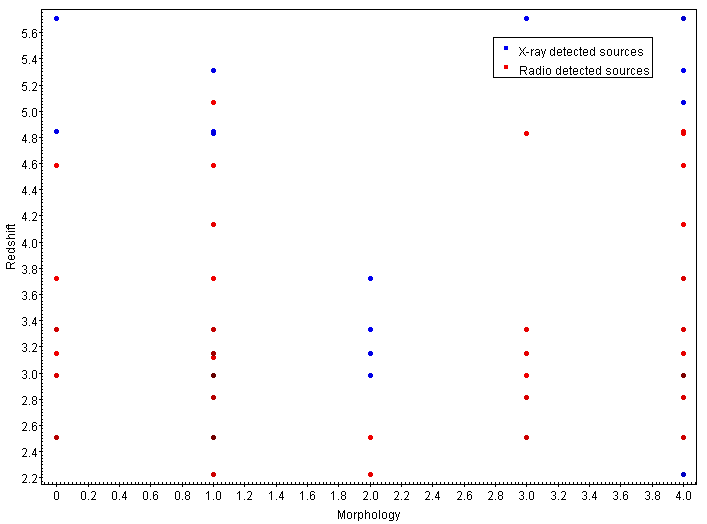

Although there is a distinct lack of correlation in most of these plots, it was to be expected as these are the conclusions drawn by previous papers.
You’re probably a bit disappointed at the lack of correlation in our results so here’s something that has a strong correlation:

